Calculating Velocity in the Toolbox
 Stephen Hanly
Member, Administrator, Moderator Posts: 64 admin
Stephen Hanly
Member, Administrator, Moderator Posts: 64 admin
This example uses the train data (https://community.endaq.com/discussion/75/vibration-from-bridge-as-train-passes-overhead#latest) to calculate velocity in three ways:
- Straight integration and double integration
- Calculating a PSD, then integrating that
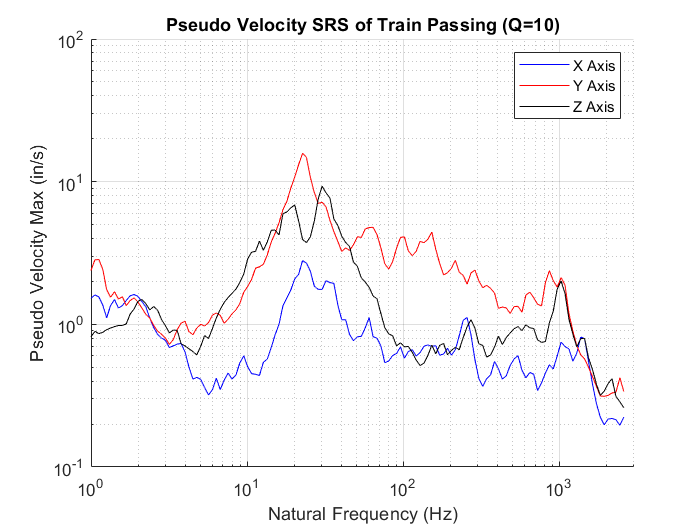
- Calculating a shock response spectrum pseudo velocity which tries to define severity (admittedly this is better for shock, not vibration data)
Here is the video of the analysis:
https://info.endaq.com/hubfs/velocity-integration.mp4
Double Integration
First is the x axis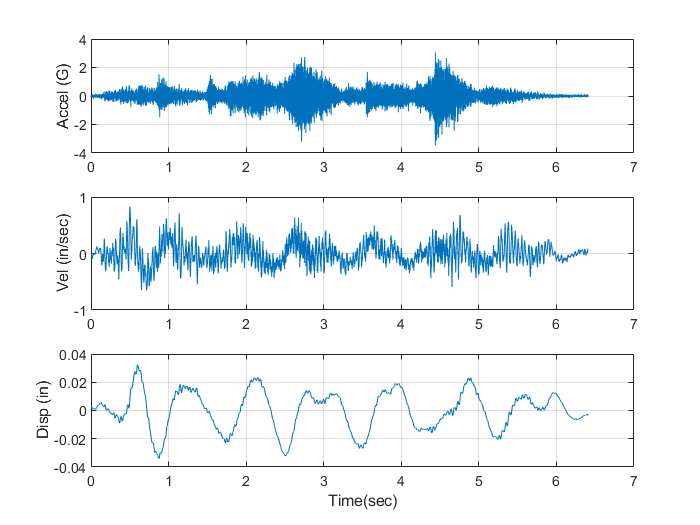
Then the y axis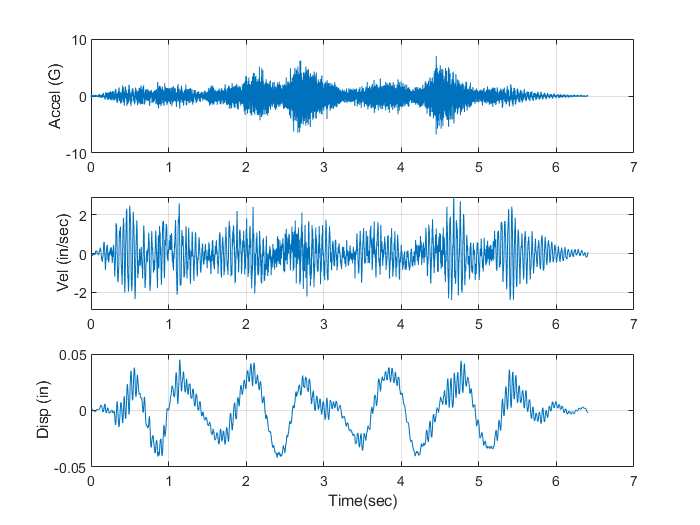
Now the z axis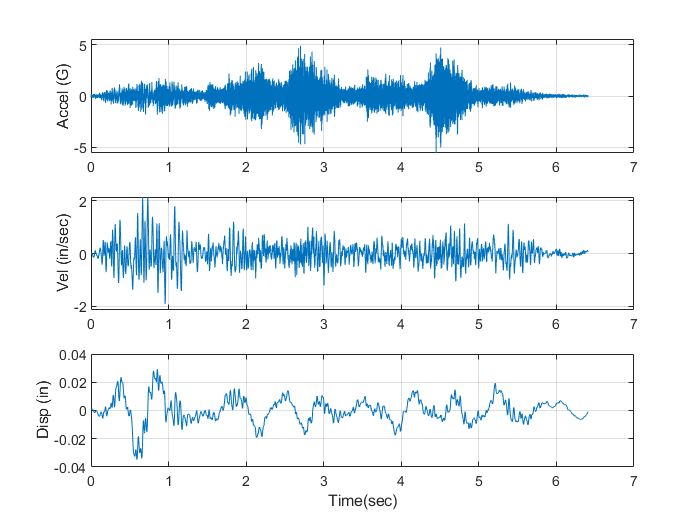
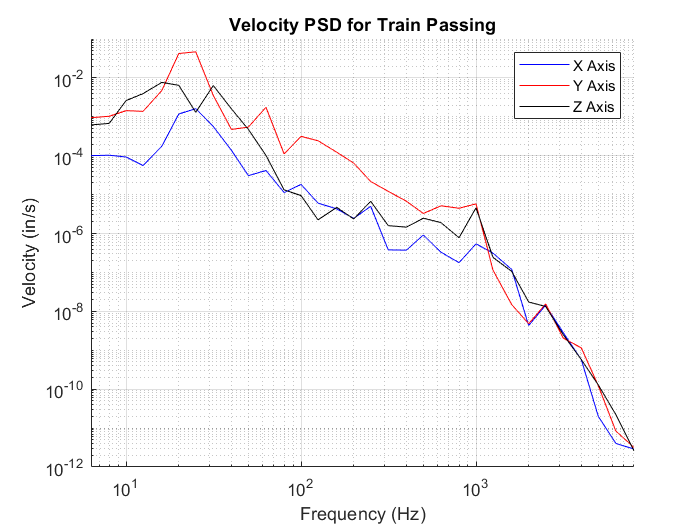
PSD
The RMS of each is calculated:
- X Axis: 0.4g
- Y Axis: 1.0g
- Z Axis: 0.7g
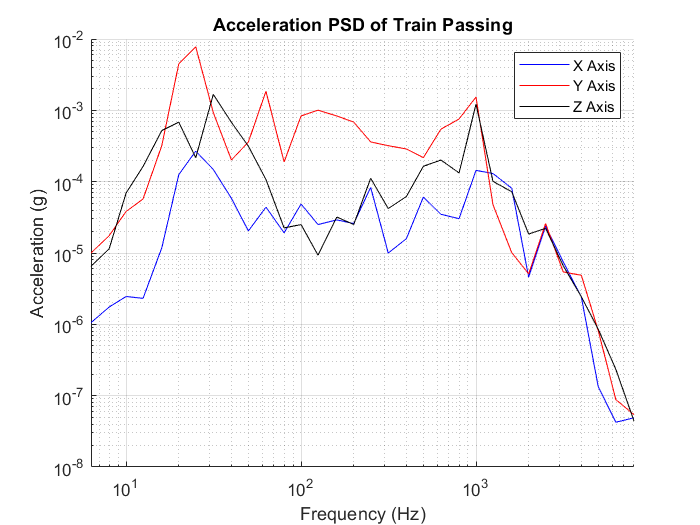
Now calculating the PSD in velocity, here is the RMS:
- X Axis: 0.15 in/s
- Y Axis: 0.70 in/s
- Z Axis: 0.38 in/s
Pseudo Velocity Shock Response Spectrum
Tagged: